|
1S663-001 (9988100-16) Data Monitoring System
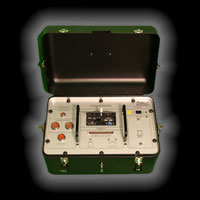
The Integrated Diagnostic System (IDS) was developed specifically for the Citation X to serve as an airborne and ground-based electrical system diagnostics tool. When installed, the Data Monitor Unit (DMU) monitors the DC, AC, and ARINC 429 input and output signals of any two Logic Modules located in the J-Boxes in the aft compartment and in the cabin. Its airborne capabilities allow it to diagnose the most difficult intermittent problems that occur only during flight. The DMU captures data while unattended and stores it internally or on a USB flash drive for later retrieval. Sophisticated triggering settings allow it to capture data beginning with a predetermined event, and then stores the data in a memory buffer for previewing of pre- or post- occurring events at a later time. |
- Features
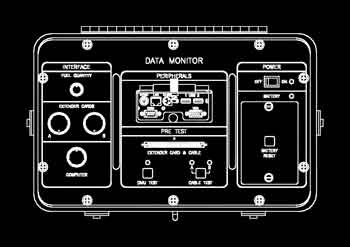
- DMU
- Attachments
- Software
- Interfaces with any PC-compatible computer with an Ethernet network connection and running any version of Windows 98 SE, XP or Vista.
- Industry standard PC-104 architecture is reliable and widely supported.
- Updated Logic Module definitions and accompanying pin descriptions compliant with the latest Service Bulletins.
- Regular IDS software updates will keep definitions and descriptions up to date.
- Utilizes all existing cable harnesses, J-box covers, and extender cards.
- Opens and displays all legacy data file formats.
- Simpler cabling between IDS components.
- Data transfer rates above 1 Mbits / sec.
- May be connected to a LAN or WAN.
- Typical signal sampling rates of 100 KHz.
- Fast internal data storage to RAM and flash memory.
- Typical data transfer rates of 1 Mbits / sec.
- Pentium IV processor with 600 MHz clock speed.
- Increased resolution with 16-bit digitization.
- High accuracy bandgap reference with maximum 20 ppm temperature drift.
- Captures data while unsupervised.
- Easy setup through notebook computer.
- Records captured data internally, or to a USB flash drive, or both.
- VGA output for monitors or KVM devices.
- External, USB-compatible mass storage interface.
- PS2-compatible keyboard.
- USB-compatible mouse interface.
- Ethernet port using RJ-45 connector.
- Improved battery charge indication using three distinct curves: charge, discharge, and open circuit.
- Continuous display of battery level.
- Quick charge of 45 minutes with external 110 / 220 VAC battery charger with international adapter kit.
- Cable and extender card testing from either connector A or B.
- Finds shorted as well as open pins.
- Increased safety and faster, surer setups.
- Compatible with existing ground support kit.
- New cable assembly allows for simpler ground support connections.
- Graphical display tools to view time-based signal curves.
- Improved triggering and filtering on several conditions: time, signal amplitudes, Arinc 429 labels.
- Real-time recording and playback.
- Record after triggering.
- Rewind, Pause, Fast Forward, and Reverse Play.
- Smart Pause: pauses when preset conditions are met.
- Opens and displays all versions of data files.
- Exports data as coma delimited files.
 |

|
||||||||||
| Operating Characteristics | |
| Temperature: | -40°C to 70°C |
| Supply Voltage: | 22 to 32 VDC |
| Supply Current: | 1 A (typ) |
| Battery Voltage: | 12 VDC |
| Charger: | 3A (max) |
| System Requirements | |
| Client: | PC-compatible |
| Operating System: | Microsoft Windows XP & Vista |
| Networking: | RJ-45, 10/100 Ethernet |
| Extender Card Inputs (nominal) | |
| Input Impedance: | > 2 M ohms |
| Standard DC: | 0 to 32 VDC |
| Resolver: | 2 Vrms excitation @ 2 KHz |
| RVT: | 2 Vrms excitation @ 2 KHz |
| LVDT: | 3 Vrms excitation @ 2 KHz |
| PWM: | 0-100%, 10 Vp, 488 Hz |
| Serial: | ARINC 429 (low-speed) |
| Fuel Quantity Inputs | |
| Left Fuel Tank: | ARINC 429 (high-speed) |
| Right Fuel Tank: | ARINC 429 (high-speed) |
| Center Fuel Tank: | ARINC 429 (high-speed) |
| Data Acquisition | |
| Channels: | 2 x 60 |
| Resolution: | 16-bits |
| Accuracy: | < ± 2 LSB |
| Conversion Rate: | 100 KHz |
| Interfaces | |
| Monitor: | VGA |
| Keyboard: | PS-2 |
| Mouse: | USB 1.1 |
| Network: | 10/100 Ethernet |
| USB: | 1.1 |
| Processing | |
| Main Board: | Athena II PC-104 |
| Processor: | VIA CoreFusion |
| RAM: | 256 MB |
| Flash: | 2 GB |
Cable Assemblies

Bulkhead Cable (9988100-3)
|

Aft Power Ground Support Cable (9988100-22)
|
 Extender Card Cable (9988100-5) |
Fuel Quantity Cable (9988100-6)
|
 Battery Charge Cable (9988100-14) |

Ethernet RJ-45 Cable (9988100-21)
|
Logic Module J-Box Covers
Aft Baggage Cover (9988100-8)
|
Forward Cabin Cover (9988100-9)
|
Adapters
Extender Card (9988100-7)
|

Ethernet RJ-45 Adapter (9988100-20)
|

Battery Charger (9988100-19)
|
Generic Signal Windows
Generic DC Volts Window
|
Generic PWM Window
|
Generic Resolver Window
|
Generic RVT Window
|
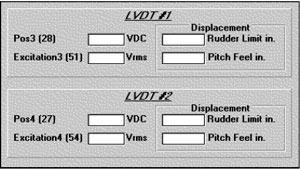
Generic LVDT Window
|
Generic ARINC 429 Window
|
Triggering & Filtering Windows
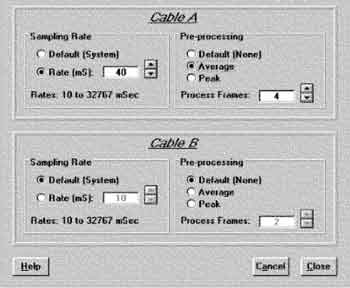
Acquisition Preferences Window
|
Triggering Preferences Window
|
ARINC 429 Triggering Setup Window
|
 Advanced Triggering Setup Window
|
Logic Module Windows
Input / Output Information Window
|
Line Graph Window
|
Secondary Trim Stabilizer Window
|
Slats / Speed Brakes Window
|
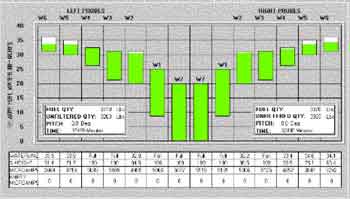
Left & Right Tanks Window
|
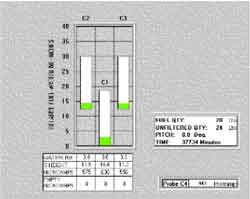
Center Tank Window
|
Hydraulic PCU Monitor Window
|
Fire Tray Window
|
Playback Windows
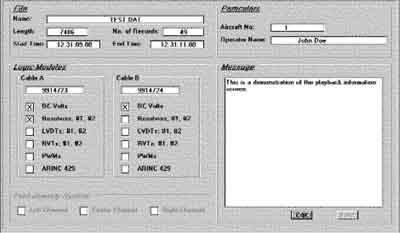
Playback File Information Window
|
Playback Control Panel Window
|